Neural Network in Excel Example
- Drew Clark

- Jan 7, 2020
- 6 min read
Updated: Jan 8, 2020
Want to create your first neural network, or understand the subject without coding? Follow this guide to discover how a neural network works in a simple excel file.
I based this example off of Milo Spencer-Harper's guide on medium.com. I thought it would be useful to see this done with excel for non-coders or those would want an introduction to the math before the code. If you would like to see his guide on How to build a simple neural network in 9 lines of Python, click here.
What is a Neural Network?
A neural network is a series of algorithms, modeled after the human brain, that endeavors to recognize patterns in a set of data.
What will our Neural Network will do?
We will create a 3 layer neural network in excel that will predict an output based on a set of example data.

Neural Network Steps
Take note of the steps in the image below, it may look confusing now, but don't worry it will make sense in a few steps. The sum and activation function make up the hidden layer shown above.

Assumptions
For our example we will have 3 inputs, and one output.
Each input can be a 1 or a 0.
Goal
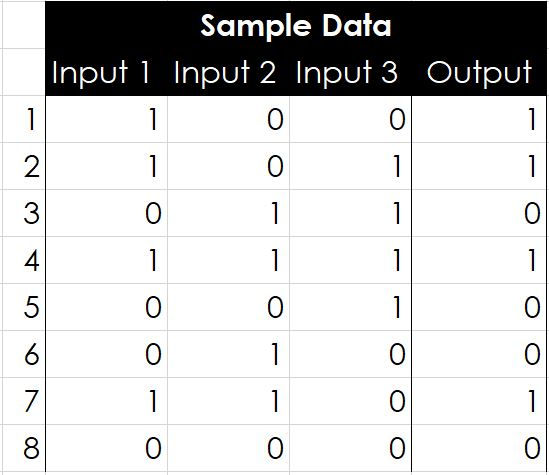
I want to train our neuron to solve the problem below. The first 8 rows are training data(sample data). Can you see the pattern? You may be able to see the output is equal to the first input column.

Step 1 - Open Excel & create the table below.
Step 2 - Create 3 columns for input weights.

Step 3 - Insert =RAND() into those three columns.
You can just type in the random data I used. 71% 76% 83%

What are these weights for?
The weights are used to train the neuron. Weights can be a positive or negative number and the larger the weight, the stronger the effect on the neuron's output. You will see the affect of weights in the next step.
Step 4 - Create a column for Bias and calculate it for row 1.
To do this we will multiply each input by its weight and then sum the products.

What's the formula in excel?
=(H4*C4)+(I4*D4)+(J4*E4)

You may need to move the formula to correspond with your table.
Step 5 - Add a column for the neuron's output.
We are going to calculate the neuron's output by normalizing the bias with the Sigmoid Function. In plain English we are going to take the bias value from the previous formula and place it where the x is, in the denominator below. The Sigmoid function will take the bias value and place it between zero and one, or "normalize" the value. See the excel formula below the graph.
Sigmoid Function

Note: If you plot the sigmoid function on a graph you will see all output values are between 0 and 1.

What's the formula in excel?
=1/(1+(EXP(-L4)))

If you are using the same numbers, you should get .67 for the neuron's output.
.67 is not equal to 1, we need to train
The neuron predicted an output of .67, which is not the correct value of 1 that we would like the neuron to predict so we must train our neuron by adjusting the input weights.
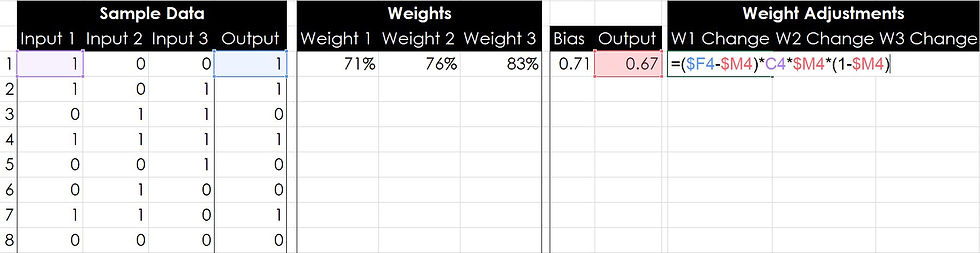
Step 6 - Add 3 columns for weight adjustments.

Step 7 - Calculate the adjustment to each weight.
To calculate the adjustment to each weight we will use the error weighted derivative formula. There are alternative formulas, that can train the neuron more quickly, but for the sake of learning this one is very simple.
Error Weighted Derivative Formula

What is the formula for the Sigmoid Curve Gradient?

What is the full formula in excel?
=($F$4-$M4)*C4*$M4*(1-$M4)
Drag this formula to the right for the remaining two weight calculations. If you do not know how to drag formulas, click here.
You should get 7.3%, 0%, 0% for your weight adjustments. Column 1 was the only column that had the correct value. This adjustment shows that column one's weight should be favored by an additional 7.3%.
How does the adjustment work?
We want to make the adjustment proportional to the size of the error. Secondly, we multiply by the input, which is either a 0 or a 1. If the input is 0, the weight isn’t adjusted. Finally, we multiply by the Sigmoid Curve Gradient.
Step 7 - Calculate your new weights for your second row of training data.
In the Weight 1 cell for your row 2 data, add the weight change 1 we just calculated to the weight 1 from the row before, see the image below.

Drag this formula to the right for the remaining two weight columns. If you do not know how to drag formulas, click here.
You should now see 78%, 76%, and 83%.
Step 8 -Drag your Bias and Output calculations down.
From training data row 2 down to training data row 8.

Step 9 - Drag your Weight Adjustment calculations down
From weight adjustments row 1 to row 8.

Step 10 - Drag your New Weight Calculations from training data row 2 down.
Make sure you do not drag from row 1, if you do your results calculations will not be correct.

Look at how the weight percentages are changing. Weight 1 is increasing, while weights 2 and 3 are decreasing. But the Output values are still not predicting the correct output?? We need more data!!!
Step 11 - Extrapolate the training data (sample data)
Copy your sample data(inputs and output) from rows 1-8 and paste it below row 8.

Step 12 - Drag your formulas from Weights, Bias, Output, and Weight Adjustments down.
To do this, highlight row 8 from the first weight to the last weight adjustment column. Then move your cursor to the bottom right corner of the highlighted row until your cursor changes to a small black X. Click and drag down.

Look at the weights now, Weight 1 has now reached 100%, and both weights 1 & 2 are close to 30%. Our outputs still aren't close the the sample data output, but they are getting closer, and that is what is important. We need to add a lot more data, but before we do we need to make an adjustment to one of our rows. Look at rows 8 and 16, anything odd about their output?
Step 13 - Adjust sigmoid formula to handle zero.
Issue: On rows 8 and 16, our neuron is attempting to predict the output of all zeros. Notice that the bias is equal to zero in this instance. Because of this, our sigmoid function is equal to 0.5, see the image below.

Training will not fix this, so we must adjust the formula.
In the first output cell, change the formula to =IF(L4=0,0,1/(1+(EXP(-L4))))
This IF formula will set the output to zero if the bias is zero, otherwise it will use the sigmoid function to calculate the output.

Drag this new function from the Output's first cell down.

Rows 8 and 16 have now been fixed! Now we need to continue training the neuron by adding more training data. We will do this by copying rows 2 - 16, from the data on the left all the way to the last weight adjustment cell.
Step 14 - Train the neuron with more data.
Copy everything from training data rows 2 through 16 (C5:Q19) and paste it below training data row 16. Remember to not include the first row!

Weight 1 has increased by 28%, and both Weights 2 & 3 are below zero. The outputs are still not that close to the sample data output. So what do we do? MORE DATA!!
Step 15 - Copy and Paste TONS OF DATA
Copy everything from training data rows 2 through 16 (C5:Q34) and paste it below training data row 31. Copy and Paste this sample data until you have more than 300 rows of training data. Remember to not include the first row!
Obviously I am not going to show what all of that looks like, but lets look at training data lines 300-308. remember we only started with 8 lines of training data.

Just like before our Weights have continued to adjust in favor of Input 1, but what does the output look like now? It looks really close!...for some of them, and ok for others. Lines 300, 302, 303, 307 are only 6%-8% off. Excluding the all zero lines where we adjusted our formula, the remaining lines are off by 19 to 23%, but we know the output must be a zero or a one. We can be pretty sure that if the neuron output is less than 50%, the sample output is a zero, if its greater than 50%, its is a 1.
What would happen if we went to 1001 rows of training data?
I chose 1001 because its the same set of sample data, weights are the only things that changed.

Comparing the same lines respectively, we are only 2% off or less on lines 1001,1003,1004,1005,1009. We also increased our accuracy by about 10% on the lines discussed earlier.
What about 5000ish lines? I promise no more after this.

100% accuracy on the ones from earlier, and about 5% off on the others.
I am guessing at this point, but it keeps boiling down to our adjustment formula needs to make quicker changes to our weights.
How can we make this neural network more accurate?
I would hypothesize, we need a formula that would increase the weight of input 1 more quickly and decrease the other two respectively. I'm guessing there are pitfalls to that logic.
Congrats! You have built a simple neural network! Please comment below and give me feedback. I am just now learning neural networks and would appreciate any help. Please share this post if you can!
Coming up
I will expand on the example above and show how to increase accuracy more quickly in future posts.
I plan on showing how to solve the above example using a neural network in JavaScript, Python, and C#.
Click here to see a great video describing what a neural network is in greater detail and how it can be used with images.


I found the explanation of building a neural network in Excel very interesting because it shows that complex concepts can be understood using familiar tools. While learning programming and data analysis, I used python assignment help UK during a challenging semester to better understand machine learning basics. It reminded me that breaking difficult topics into smaller steps makes learning much easier and more enjoyable.
best weights I could find are: 38,19 -12,81 -12,64
Taken lots of efforts to explain in a simple way. Tried but not getting the end result. will test again.
Thanks
Thank you very much, Drew, I'll use this in my undergraduate class on Geomath!
Two minor remarks:
I agree with e, above. Your net doesn't include a bias. I just changed the 'Bias' header to 'Sum'...
In (the first) Step 7, the formula is correct in the screenshot but wrong in the text: it's
=($F4-$M4)*C4*$M4*(1-$M4) without $ before the first 4.
Kudos!
The conception of Bias seems to be wrong in the article above.
The idea is that each input having certain weights in your case w1,w2 and w3 and some arbitrary w0 which does not depend on Inputs at all and named the Bias. In such a case arguments for Sigmoid would be = (w1 * i1 + w2 * i2 + w3*i3 + bias). This would also remove unnecessarry evaluation of zero condition for your neuron.